How to create a "Top 10 Customers" report
When working with reports with a large number of grouped rows, it is sometimes useful to be able to filter away groups with small numbers and to focus on the e.g. the top 10 groups. This can be very useful, e.g. if you want to create a "Top 10 Customers" view or "Top 10 Debtors" list. Follow the below steps to achieve a top N view of your data:
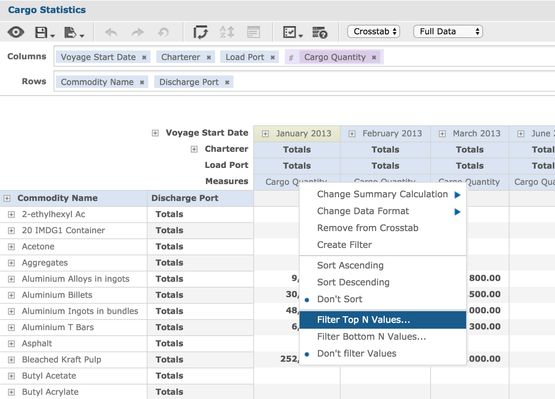
Make sure you are using "Crosstab" as the type of view for your data. Add a measure and group it by a field, e.g. "Customer". Right click the measure in the crosstab and select "Filter Top N values" (or use Bottom if that is what you are looking for):
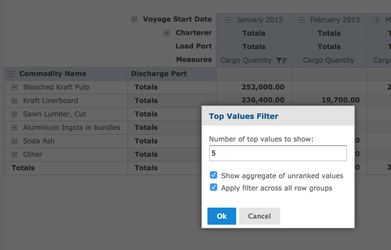
Enter the number of top values you want to see and click "Ok". All others will be grouped into a group called "Other":