Voyage Analysis Dashboard
- Former user (Deleted)
- Former user (Deleted)
- Former user (Deleted)
Short Description
The Voyage Analysis Dashboard was established to give Senior Operator’s (primarily operations and chartering managers) visibility over day to day voyage operations and their possible deviations. This to enable faster reaction from staff to problems and deviations in voyages. Ship owners can get an early warning/s for a number of selected voyages operated by different operators and be able to identify and react quickly to problems and deviations. Daily snapshots are automatically taken for every voyage in progress. The main dashboard window displays voyage figures with deviations on voyages waiting to be operationally closed. Note: Red = deviation has negative impact on voyage result, Blue = deviation has positive impact on voyage result, Black = no impact on voyage result.
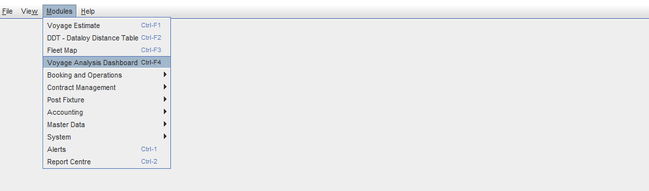
Location: Modules > Accounting > Voyage Analysis Dashboard
Chapters:
Long Description
Log-In
Log In:
Open the Voyage Analysis Dashboard URL provided by the main contact person in your organisation. The Voyage Analysis Dashboard log-in window opens.
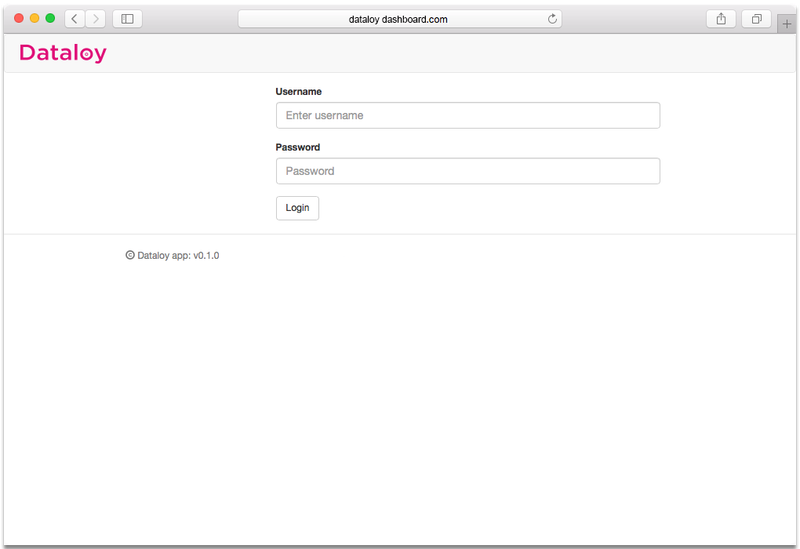
Enter username under Username.
Enter password under Password.
Click Login. The log-in window will close.
The main dashboard window opens covering the full screen.
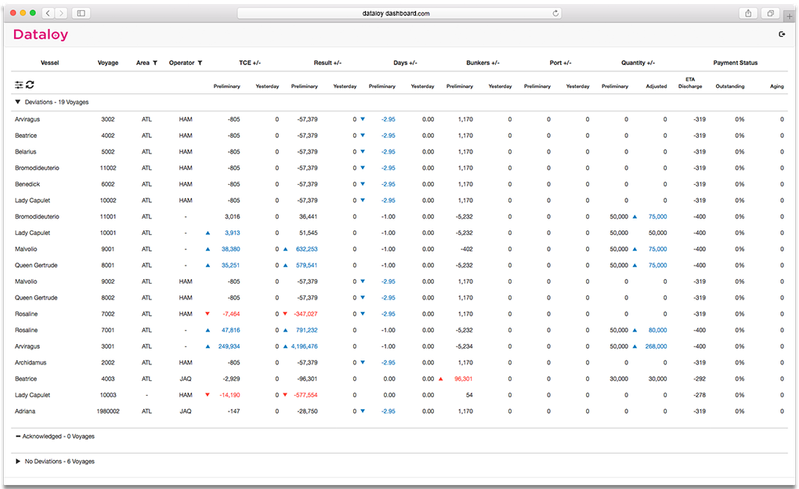
Viewing and Managing Deviated Voyages
- Description: The Senior Operator views the Voyage Analysis Dashboard to identify voyages with deviations on voyages waiting to be operationally closed.
- The Operator views the voyage analysis dashboard to identify voyages with problems – highlighted at the top of the Deviations tab. Below the Deviations tab the User locates a tab listing voyages with acknowledged deviations and a tab with voyages without deviations.
- The Senior Operator creates and saves filters to ensure that only the voyages, operators and vessels he/she are responsible for will display at the next login.
- The Senior Operator starts at the top with the most important voyages, discusses with an Operator why there is a deviation, returns to the voyage analysis dashboard to add a comment/remark about why. The procedure is repeated until only voyages with current good results are left.
- The Senior Operator may also change the sensitivity to see possible impact on changes. He/she may also open detailed graphs displaying voyage progression alongside entered remarks and view the audit log history of any actual changes made. Any remarks made by an Operator explaining the difference in numbers are also registered. A Senior Operator must then only acknowledge that the figures have been seen. If the Senior Operator can also view the Post Voyage Analysis for more detailed information of any voyage.
- Note: Red = deviation has negative impact on voyage result, Blue = deviation has positive impact on voyage result, Black = no impact on voyage result.
Viewing and Managing Deviated Voyages
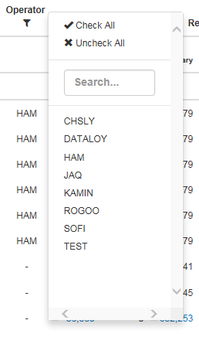
Description & Data: Expected Result: 1. Create filters by area and/or operators by clicking the Area and/or Operator icons and select relevant Area/s and/or Operator/s.
Note: Only voyages with Progress = Scheduled or Operational are included.The system automatically updates, displaying only the selected voyages, operators and vessels.
Example:
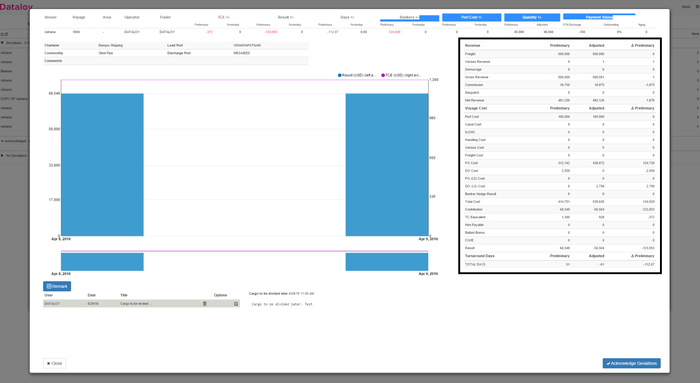
2. Click applicable voyage in the Voyage Analysis Dashboard window. A pop-up opens covering the entire screen containing data for the selected voyage and additional information, graphs and post voyage analysis overview and remarks fields.
Example:
Vessel Adriana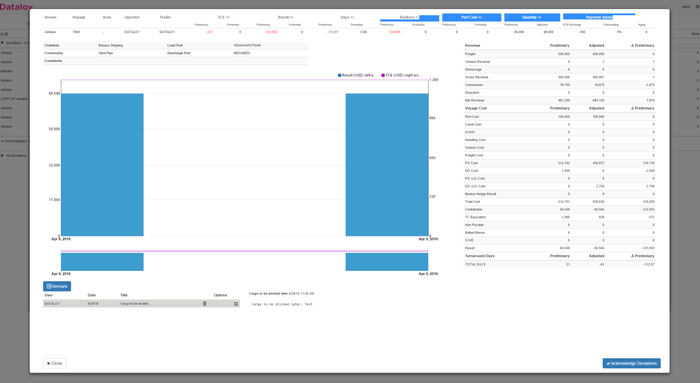
3. Click applicable remark to view comments from Operators and to select concern type. The information of the selected remark displays to the right of the remarks list. The Senior Operator views the comments from the Operator and selects concern type.
Example: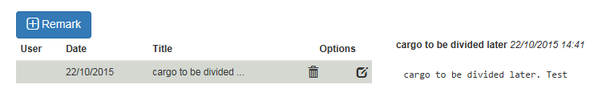
4. Click applicable remark/s edit icon to open the Edit Remark comments field.
Note: Hover the cursor above and the icon will switch from black to red. Also, a remark can be added by an operator without access to the dashboard by entering a remark against the voyage (using the standard remarks function). It will appear in the dashboard as well and vice versa.The Edit Remark icon switches from black to red and once clicked the Edit Remark pop-up opens.
Example 1:
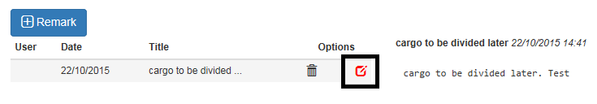
Example 2:
The Edit Remark field
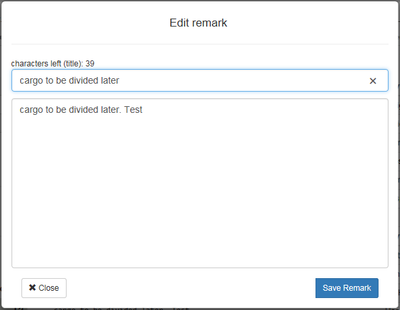
5. Enter follow-up time and click Save Remark. The Edit Remark field will close and the added follow-up time saved.
6. Click Acknowledge Deviations. A pop-up requesting a remark prior to acknowledging the deviation opens.
Example:
7. Enter comments to accept the deviation and click Create Remark. The pop-up will close, the remark added and the voyage moved from the Deviations tab to the Acknowledged tab. The pop-up containing data for the selected voyage will close and the tab listing voyages with deviations will fill the screen. 8. The Senior Operator returns to the main voyage screen and selects the next voyage with deviations. Steps 1-7 are to be repeated until only voyages with current good results are left. Viewing Post Voyage Analysis Detail
Description & Data: Expected Result: 1. Click applicable voyage in the Voyage Analysis Dashboard window. A pop-up opens covering the entire screen containing data for the selected voyage and additional information, graphs and post voyage analysis overview and remarks fields.
Example:
Vessel Adriana2. For voyage information, view the Post Voyage Analysis, located to the right. Example:
Vessel Adriana
3. Click the blue boxes in the graph above the remarks. For each, a separate detailed voyage audit log opens.
Example:.png?version=1&modificationDate=1445534577000&cacheVersion=1&api=v2&width=500&height=548)
4. Click Close. The Detailed Voyage Audit Log will close. No changes can be made in it - for information purposes only. 5. Click applicable remark to view comments from Operators and to select concern type. The information of the selected remark displays to the right of the remarks list. The Senior Operator views the comments from the Operator and selects concern type.
Example:6. Click applicable remark/s edit icon to open the Edit Remark comments field.
Note: Hover the cursor above and the icon will switch from black to red. Also, a remark can be added by an operator without access to the dashboard by entering a remark against the voyage (using the standard remarks function). It will appear in the dashboard as well and vice versa.The Edit Remark icon switches from black to red and once clicked the Edit Remark pop-up opens.
Example 1:Example 2:
The Edit Remark field
7. Enter follow-up time, comments querying the deviation and click Save Remark. The Edit Remark field will close and the added follow-up time and comments querying the deviation saved.
8. Click Close. The main voyage pop-up will close, the remark added. The voyage is returned to the Operator for further feedback and discussion. The voyage remains listed in the Deviations tab. 9. Click the deviations settings icon at the top left above the Deviations tab. The Deviations Settings pop-up opens.
Example:The Deviations Settings pop-up
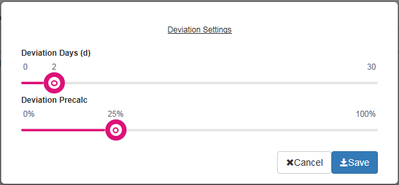
10. Alter the parameters in the pop-up and click Save. The parameters automatically updates according to the new settings. The main Deviations voyage screen automatically updates. 11. The Senior Operator returns to the main voyage screen to see if there are other voyages with deviations. Steps 1-7 are to be repeated until only voyages with current good results are left. No Freight Received
Description & Data: Expected Result: 1. Log in to the main Voyage Analysis Dashboard window. Successful login - the main dashboard will open covering the full screen.
2. A voyage is noticed not to have received freight. No information will show regarding freight for the voyage in the main dashboard window. 3. Check the additional ETA fields of the voyage in the main dashboard for further information. The ETA information of the voyages are displayed across the main dashboard.
4. The responsible Oerator is contacted to determine freight status. The information provided by the Operator should be added to the system. 5. Click applicable remark to view comments from Operator/s. The information in the selected remark displays to the right of the remarks list. The Senior Operator views the comments from the Operator (if any).
Example:7. Click applicable remark/s edit icon to open the Edit Remark comments field.
Note: If there is/are no remark/s - add a remark. Also, a remark can be added by an operator without access to the dashboard by entering a remark against the voyage (using the standard remarks function). It will appear in the dashboard as well and vice versa.The edit remark pop-up opens.
Example:
The Edit Remark field
8. Enter concern type, follow-up time, comments and click Save Remark. The Edit Remark field will close and the added concern type, status, follow-up time and comments saved.
9. Click Acknowledge Deviations. A pop-up opens requesting a remark be created prior to acknowledging the deviation.
Example: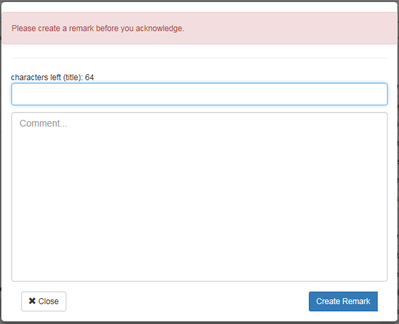
10. Enter appropriate comment to accept the deviation and click Create Remark. The pop-up will close, the remark added and the voyage moved from the Deviations tab to the Acknowledged tab. The pop-up containing data for the selected voyage will close and the tab listing voyages with deviations will fill the screen.